Author Resources
Video Transcript: How to Share Your Research Video
This is the transcript from AJE's video about sharing your research through video content.
To read the video's transcript, please click here.
There are a number of ways to find out if your paper is gaining traction. A good place to start is your journal's website. Your journal may provide the number of article views and downloads directly on your article page. Reach out to the journal editor if you need help finding this information.
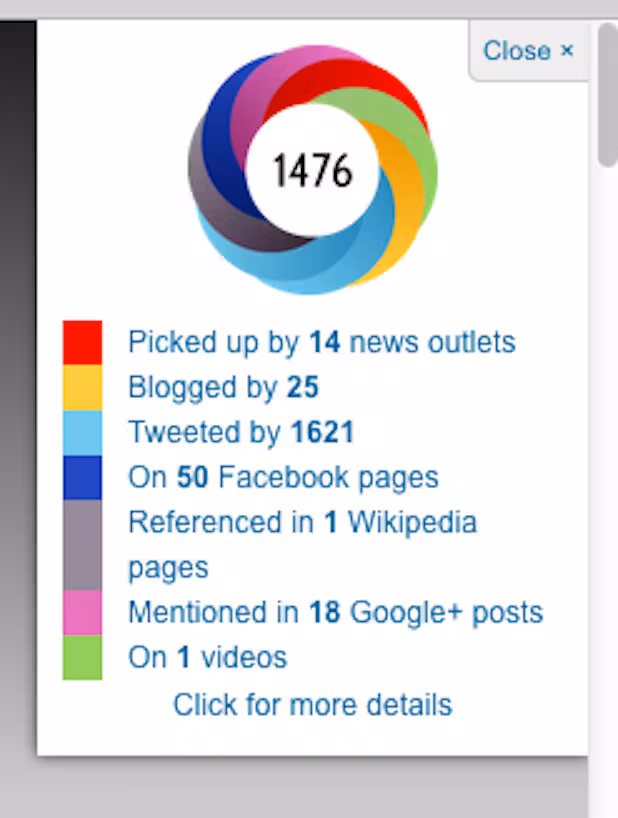
The Altmetric bookmarklet compiles press and social media mentions for recently published articles. This tool allows you to track online conversations about your research and engage with your audience. Simply add the Altmetric It! button to your bookmarks. Then, click the button when you've navigated to a journal article of interest to see the Altmetric data.
Google Scholar conveniently tracks citations for journal articles. You can search for your article by entering your name, affiliation, and other search criteria on the My Citations page.

Link up with other researchers and make your research visible through ResearchGate's online community. This site allows you to share your research and track statistics on your viewer network. Consider setting up an account on Kudos to make your video accessible to broader audiences.
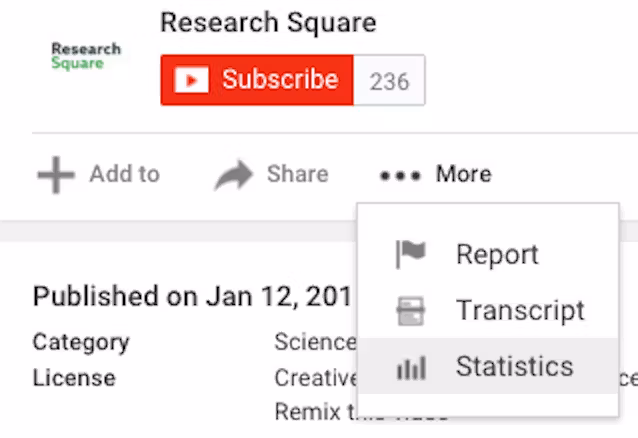
YouTube offers several metrics for tracking your video's viewership:
Vimeo provides four metrics for tracking video performance:

To increase viewership and get the word out about your research, share your manuscript and video widely and often!
AJE provides services for other media besides videos such as custom illustrations and research promotion.
For more information about AJE's Video Abstract service, visit our website. You can also view more videos from AJE on our YouTube channel.
This is the transcript from AJE's video about sharing your research through video content.
Tips to help you design a powerful research poster. Learn how to use white space, color, fonts, and organization to effectively share your research.
Learn how to share your research videos to reach a wider audience.